Today’s theme is Waffle and I would like to create a waffle chart. Waffle charts are excellent for displaying and comparing proportions or part-to-whole relationships within a dataset. They are particularly useful when you want to show how a whole is divided among different categories or segments.
However, my visualisation library of choice lets-plot does not have a pre-made “geom” or layer specifically for waffle charts. This means that I have got to get a bit more hands-on to make one today. My plan is to piece it together myself using lets-plot’s building block shapes and layers.
Singapore Population Census Data
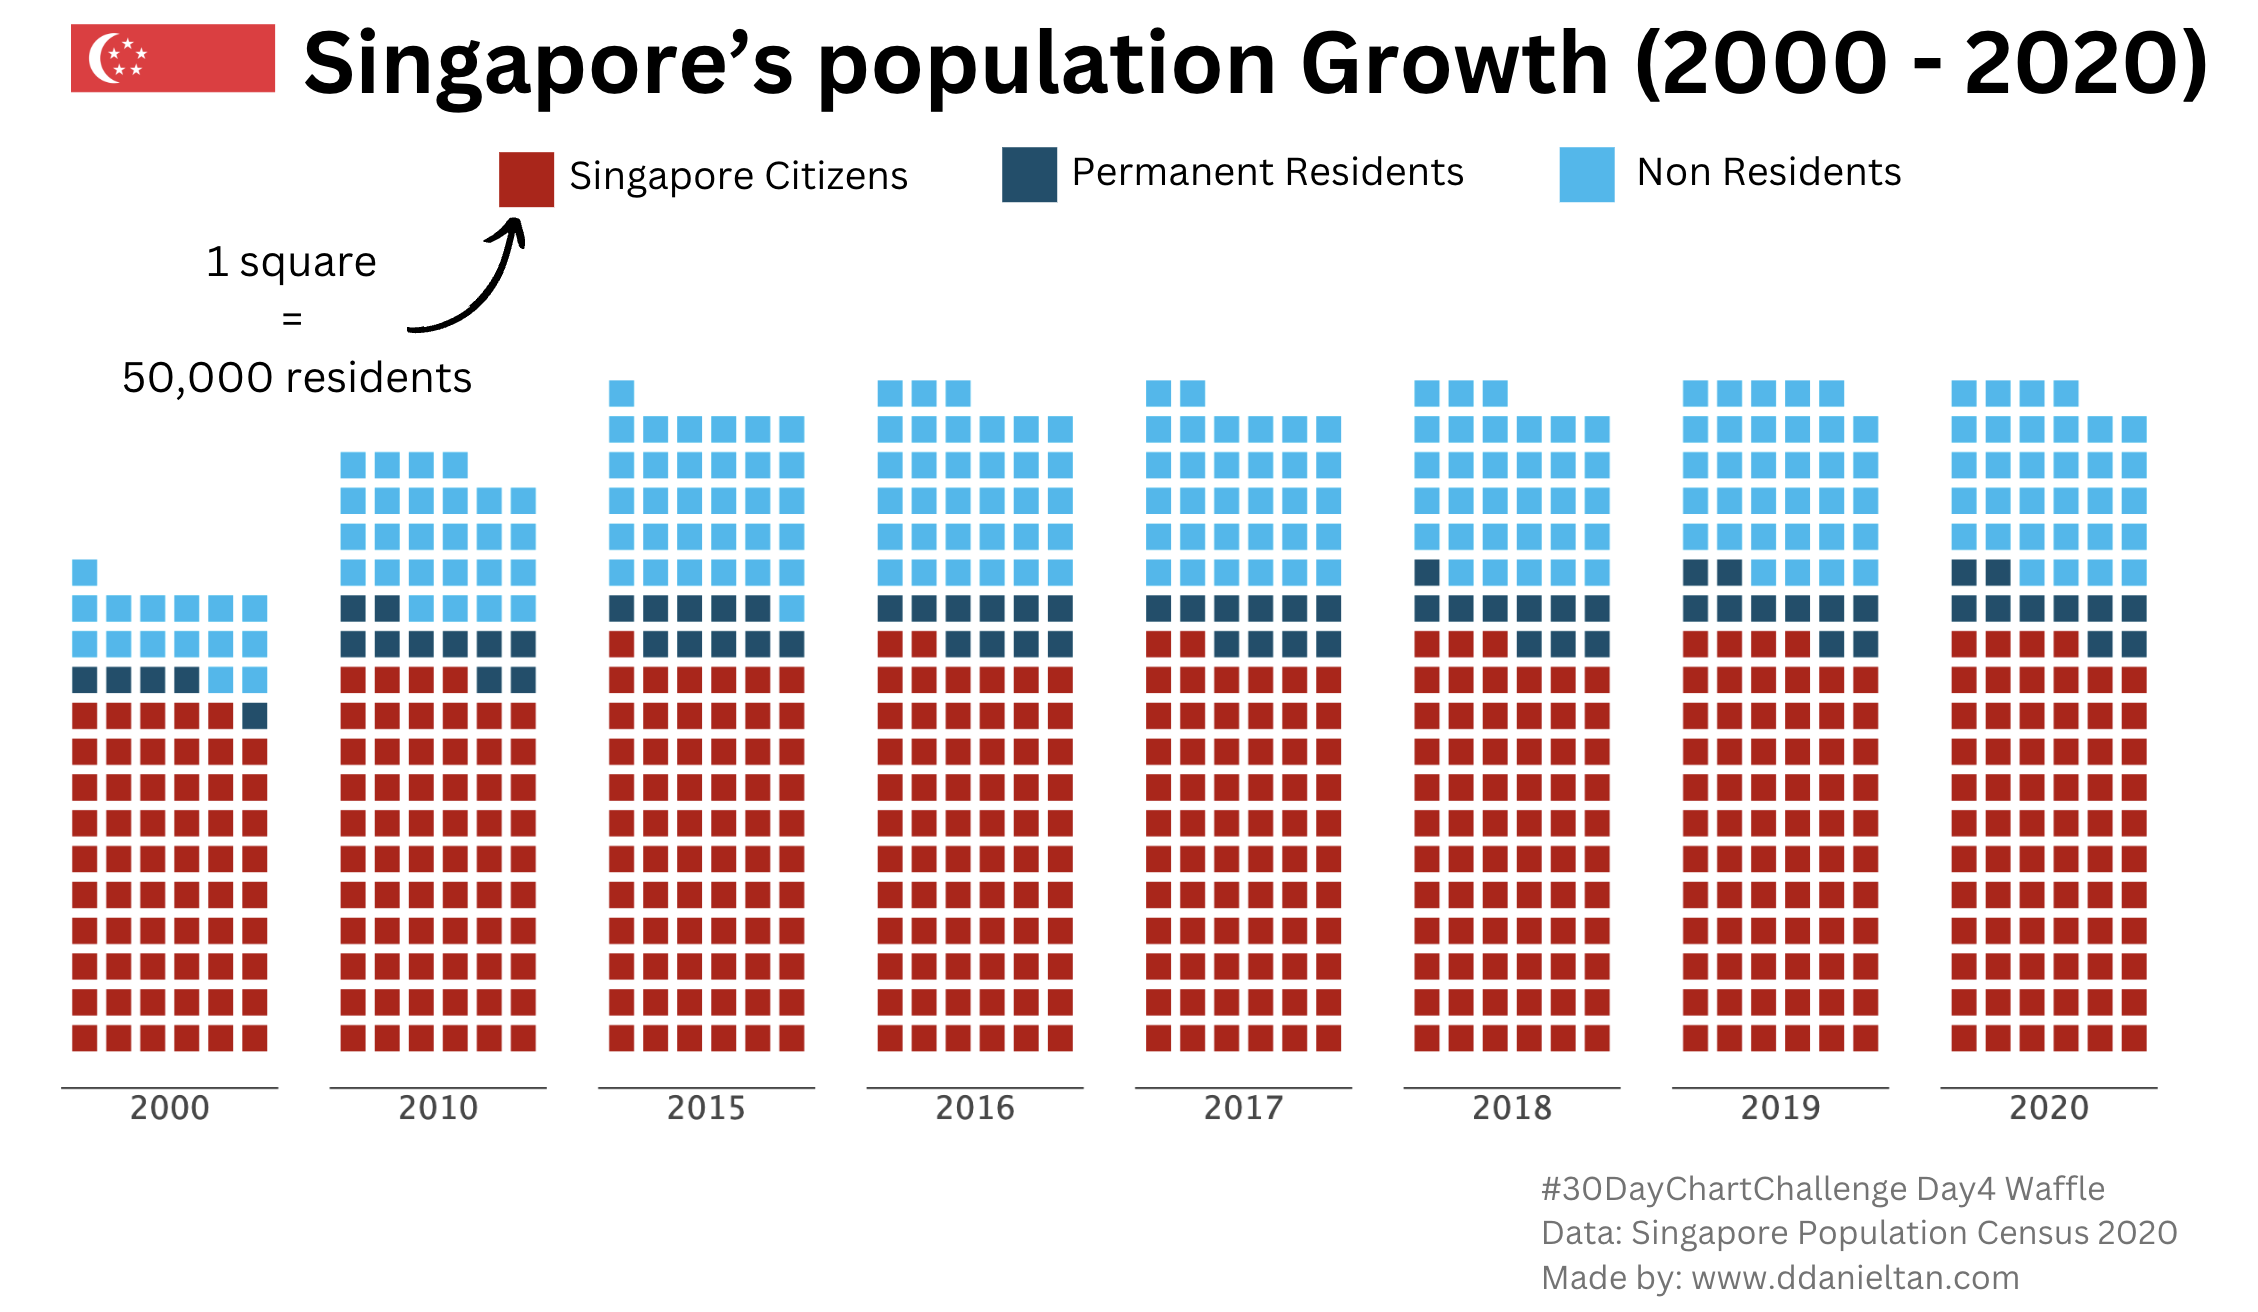
For today’s dataset, I opted to use Singapore’s population census data from 2000 to 2020 (Source).
This dataset tracks our population growth of Singapore residents (split either as Singapore citizens or Permanent residents) and our non residents. I believe a waffle chart is a good visualisation for this type of data to show both the growth of the overall population, as well as, its component groups.
To condense the population information, I decided that every square on my waffle chart would represent about 50,000 population.
The main way I will create my waffle chart is by manipulating the geom_tile layer. This allows me to draw equally spaced rectangular squares. This stage took the longest time as I experimented with many combinations of width, height and colours to implement what I envisioned. With more than 1 waffle to draw, I created a helper function.
X =6Y =20create_waffle(x=6,y=20, data=(59, 5, 15), year=2000)
Composition with gggrid()
Once the waffles were ready, I also had the chance to use gggrid() for the 1st time in this challenge as I had a simple composition of lining each waffle horizontally.
Code
waffles = []for row in pop.select(['year','sg','pr','nr']).rows(): year, sg, pr, nr = row waffles.append(create_waffle(x=X, y=Y, data=(sg,pr,nr), year=year))w = (gggrid(waffles)+ ggsize(width=1000, height=500))w
Unfortunately, I ran into a limitation of gggrid() here. I was unable to insert a title, caption or legend on my final composition of multiple charts. This was slightly frustrating and I sorely missed the equivalent functionality that is available in R’s ggplot ecosystem e.g. patchwork.
Finishing up on Canva
So, I moved my chart over to Canva for few final touches, and here’s the end product!
TIL
Polars has a convenient rows() method that returns rows of selected columns as a List of Tuples. Useful if your collected data fits in memory.
Let-plot geom_tile works really well with np.linspace to control width and height.
I cannot apply titles, captions or legends on a composition of plots using gggrid(). So in the future, I need to draw those elements on the component graphs instead.
Attempting to build up a visualisation from base parts is a challenging task, but being able to achieve your original vision is a great feeling! 😁